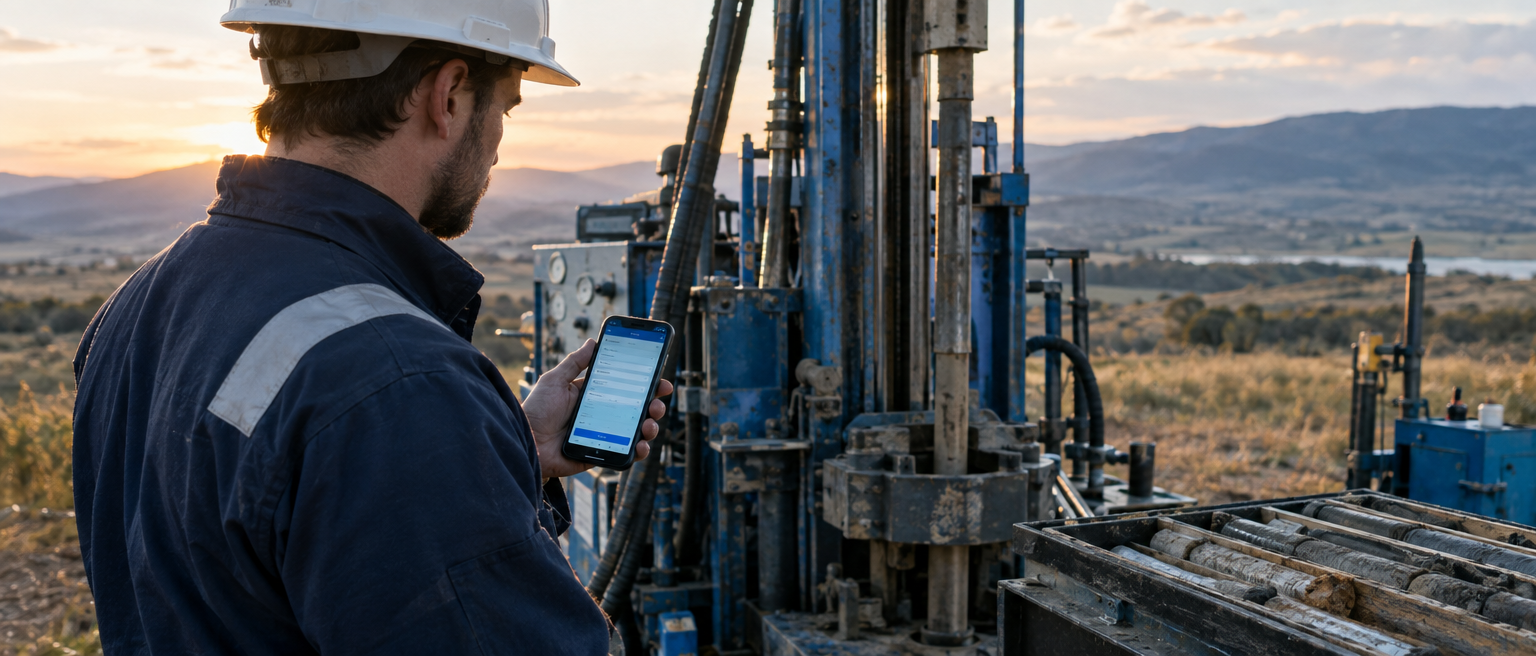
What is a borehole log?
A borehole log is the written record of a borehole. It says what was encountered, at what depth, what was sampled or tested, and what the driller or engineer observed along the way.
It describes one vertical location
The log is anchored to a specific place — coordinates, ground elevation, and a borehole ID. Everything in it refers to that one spot on (and under) the earth.
It is written during and after drilling
Loggers record strata changes as the drill advances, then add laboratory results and refined interpretations afterward. The log therefore blends observation and interpretation — in a specific, disciplined order.
It follows conventions
Professional guides standardize what to record and how, so a log written in one firm can be read by another. ASTM's field logging guide D5434 and soil classification practice D2487 are two common references.
It outlives the project
Long after the rig leaves, the log remains. It is reused for design, construction, litigation, research, and by future projects on the same site. A good log is an investment in everyone who comes later.
What goes into a borehole log?
Six kinds of information, in an order that runs from pure observation toward interpretation. Explore each group:
Lithology
The core of the log: what the ground is made of, layer by layer, with depths.
- Depth intervals
- Where each stratum starts and stops, measured from ground level
- Material description
- Colour, texture, plasticity — the formal description of each layer
- Soil classification
- USCS group names and symbols (e.g., SP, CL) for engineering use
- Strata changes
- Transitions between materials, including if they are sharp or gradual
- Moisture condition
- Dry, moist, wet — noted with each stratum
- Origin
- Whether a deposit is natural, fill, or disturbed
- Consistency / density
- How compact or stiff the material appears
- Rock descriptions
- Weathering, fracturing, strength
A vertical record of the ground
Hover over a stratum. Every interval is an observation, and each one carries its own attached data: a classification, a sample, a blow count, and more.
Hover or tap a colored stratum on the left to see the structured data behind it.
How soil and rock are described
The Unified Soil Classification System (USCS) gives soils consistent names and two-letter symbols, so a description written in one country can be read in another.
GW, GP
Well-graded / poorly graded gravel
Key tests: Grain size (sieve analysis)
Typical origin: River terrace gravels, railway ballast
Why it matters: Permeability and drainage behaviour depend strongly on grading
SW, SP
Well-graded / poorly graded sand
Key tests: Grain size, SPT N-value
Typical origin: Beach and dune sands, alluvial channel fills
Why it matters: Density drives settlement and liquefaction assessment
GM, GC
Silty / clayey gravel
Key tests: Grain size, Atterberg limits
Typical origin: Glacial till
Why it matters: Fines control whether the material drains or not
SM, SC
Silty / clayey sand
Key tests: Grain size, Atterberg limits, moisture content
Typical origin: Weathered sandstone residuum
Why it matters: Fines content changes strength and compaction behaviour
CL, ML
Low-plasticity clay / silt
Key tests: Atterberg limits, moisture content, vane shear
Typical origin: Floodplain silts, lacustrine clays
Why it matters: Plasticity governs shrink–swell and compressibility
CH, MH
High-plasticity clay / silt
Key tests: Atterberg limits, oedometer, strength testing
Typical origin: Marine clays, residual tropical clays
Why it matters: High plasticity soils shrink, swell, and creep the most
The reference standard is
ASTM D2487-17(2025). Classification always pairs with — never replaces — the logger's full visual-tactile description.
Field measurements & samples
The Standard Penetration Test (SPT) is one of the most widespread measurements recorded on borehole logs. It turns a soil's resistance to being penetrated into a number, and delivers a physical sample at the same time.
Drive the split-spoon
A 63.5 kg hammer drops 762 mm, driving a standard split-barrel sampler into the soil at the bottom of the hole.
Count the blows
Blow counts are recorded for each of three 150 mm increments of penetration.
Add them up
The SPT N-value is the blows for the second plus third increments — the first increment is treated as seating disturbance.
Recover the sample
The split barrel is opened: a soil sample is logged, labelled with its depth, and sent for laboratory testing.
Interpret with care
N-values correlate empirically with density and strength, subject to corrections — they inform judgment, they don't replace it.
Method reference:
ASTM D1586/D1586MOne borehole log, many users
The same log gets read differently by different disciplines. Select one to see which layers of the record each depends on.
Geotechnical engineering
Bearing capacity of foundations
Settlement and compressibility of strata
Pile design depths (end-bearing strata)
Liquefaction screening (SPT N-values)
Slope stability parameters
Dewatering design (permeability)
Data vs. interpretation: a chain of custody
A borehole log carries a mix of what was directly observed and what was concluded. Keeping that chain intact — from field observation to engineering judgment — is the whole point of good logging.
Observation
The driller sees grey, moist, soft clay from 1.2 to 3.5 m.
Description
The logger writes: firm grey silty clay, low plasticity, moist.
Classification
The material is classified CL under the USCS.
Testing
Lab results confirm the plasticity and moisture content expected for a CL.
Interpretation
The engineer judges: firm, compressible, keep footings above or raft on it.
The observation is fact. The interpretation is judgment, and judgment belongs to a qualified professional. When those get separated — or worse, blended with no way to tell them apart — downstream users lose the ability to re-evaluate the ground with what was actually seen.
Borehole geophysics vs. conventional logging
Conventional logging records samples and tests at discrete depths. Borehole geophysics lowers instruments down the finished hole to take continuous measurements of the entire profile.
Conventional logging
Samples and tests at discrete depths
SPT, CPT, split-spoon and core samples
Visual description by a trained logger
Physical samples that can be re-tested
The default record on nearly every project
Borehole geophysics
Continuous measurement along the hole
Natural gamma, resistivity, caliper, acoustic and optical imaging
Reveals thin beds and fractures sampling can miss
Instrument-based, so it needs experienced interpretation
Common for hydrogeology and detailed rock studies
Reference:
USGS — Borehole Geophysics. The two are complementary: geophysics gives continuity, sampling gives ground truth.
How much of it is actually digitized?
Public agencies hold enormous borehole archives — Geosetta, one collector of public geotechnical data, reports 2,100,000+ boring logs from public agencies in 8 countries. But "digitized" can mean a scanned PDF or a structured, searchable record. The difference matters.
Florida
169,316 boring logs in this state's archive, split by format.
815
168,501
Almost every log in this archive exists only as a scanned PDF. The record is preserved, but not yet searchable or structured — a human still has to read each one.
Why structured data matters
A scanned log preserves information for one patient reader at a time. Structured data — where each depth, material and test is a field rather than a phrase — lets archives be searched, mapped and reused at scale.
Alberta Geological Survey borehole compilation
The Alberta Geological Survey publishes a compilation of its borehole data — hundreds of boreholes published not as scanned logs, but as a structured dataset. Each borehole carries its location, and each encountered layer carries its depth interval and description, ready for mapping, filtering, and download by anyone.
USGS GeoLog Locator
In the United States, the USGS GeoLog Locator lets anyone search borehole and well records by map area and download the digitized logs — an example of what becomes possible once borehole records are structured and mapped rather than filed.
The pattern repeats across the world: agencies that invested in structured borehole data can serve it to everyone instantly; agencies holding only paper and scans serve it one patient reader at a time.
From document to data
The same five log entries, two ways. Toggle to see what changes when the log stops being only a document and becomes data.
BH-24-03  drilled 12/07/2024  rotary
0.0–1.2 m  brown SAND, loose, moist (SP)
1.2–3.5 m  grey silty CLAY, firm (CL)
S-02 @ 1.5 m  N = 12  recovery 92%
GWL 3.8 m (24 h)
Every fact is there — but locked in prose. Finding all CL layers across 300 logs means a person reads 300 logs.
Illustrative rendering of the same information in two forms — not output from any specific system.From drilling to decision: the borehole data lifecycle
A borehole log isn't written in one sitting — it's the product of a twelve-stage workflow that starts before the drill and ends years later, when someone else reuses the data.
Plan
Scope the investigation: how many holes, how deep, what questions the data must answer.
Stage 1 of 12 — every stage writes part of the log, or decides how usable it will be.The gap between a good log and a usable one
Each step of the traditional workflow works — the challenge is that they barely connect. Toggle to compare a fragmented workflow with a connected one.
Field observation
Written on paper in the weather, at the drill.Sample label
Bagged, marked by hand.Lab result
Returned in a spreadsheet weeks later.The log itself
Typed up again in one piece of software.The report
Assembled in another program, filed as a PDF.The archive
A scanned folder — findable only by those who already know it exists.The fragmented workflow
In a fragmented workflow, the same facts are re-entered at each step — from paper to spreadsheet to report to scan. Each re-entry risks transcription errors, and the archive that results is a document, not a dataset.
What good digital borehole data looks like
Six principles that turn a borehole record from a document someone once wrote into data everyone can use.
Captured once, at the source
Data entered where and when the observation happens — not re-typed from paper afterward.
Structured, not just scanned
Depths, materials and test values stored as fields a computer can filter — not only prose on a page.
Observation kept separate from interpretation
What was measured stays distinguishable from what was concluded.
Linked through the whole chain
Sample, lab result, log, report and archive all refer to the same underlying record.
Preserved for the next project
The dataset outlives the report that used it — findable and reusable, not filed and forgotten.
Attributed and accountable
Who logged it, who tested it, who signed it — a professional record, not an anonymous file.
Data supports judgment. It never replaces it.
A borehole log is a professional document. No tool — analog or digital — changes that.
The log records what one borehole found, at one place, at one time. Interpreting what the ground means between and beyond boreholes remains the work of qualified professionals.
Software can make the record structured, connected and reusable. It cannot decide whether the clay is normally consolidated, or whether that gravel layer is a channel worth worrying about. Better data makes professional judgment better informed — that's the whole claim.
Field observations are interpreted in context
Design parameters are selected by a professional
Standards guide practice; judgment applies them
Every log carries accountability through review and sign-off
Where aQRate enters the workflow
Everything above describes the discipline of borehole logging. aQRate — a data platform for environmental and water work from Roshan Water Solutions — exists for the part after the observation: capturing it once, keeping it structured, and making it reusable.
Capture in the field
Form-based digital data capture replaces the paper log and the re-typing that follows it — observations are structured the moment they're made.
Keep the chain linked
Field entries, sample IDs, laboratory results and report sections all refer to the same record, so nothing gets retyped or lost between steps.
Review and report
Dashboards and generated reports read from the same data — the deliverable is a view of the record, not a separate copy of it.
Preserve for reuse
The result is an archive that behaves like data: searchable next project, next year, by the next person.
The workflow, concretely
This is the same twelve-stage lifecycle from earlier — here's how it reads when the record is digital end to end.
Start from a template
A borehole logging template — forms, dashboard and report already defined — so the data structure exists before the first hole is drilled.
Log in the field
Fill the forms at the drill site. Each entry is captured once, as structured data.
Review on the dashboard
See all records in one place — every borehole, every layer, as data rather than documents.
Generate the report
Produce the deliverable from the same records, with the full chain intact.
What you're looking at below
The next section is not a mock-up: it's a live, editable preview of aQRate's Borehole Logs Starter Template — the forms, the dashboard and the report, populated with sample records you can explore.
Forms
Lithology Log and Borehole Log — pre-built for depth intervals, strata descriptions, USCS soil types, moisture, and consistency
Dashboard
Borehole Log Demo — every record visible in one list view, filterable as data
Report
Borehole Log & Drilling Report — generated from the same records
Sample data
22 sample records already loaded, so you can see the structure in use before entering your own
Every principle on this page is a line of software.
Captured once. Structured, not scanned. Linked from field to archive. That's not a description of what aQRate does someday — it's the Borehole Logs Starter Template, and it's below.
Borehole Logs Starter Template — live preview
A working preview of the template: explore the forms, the dashboard and the report with the sample records loaded.
Lithology Log
Borehole ID
Sample ID
From (m)*
To (m)*
Primary Soil Type*
Special & Regional Formations-Type
Gravels & Gravel Mixtures-Type
Sands & Sand Mixtures-Type
Fine-Grained Soils-Type
Color*
Moisture*
Consistency/Density*
Lithology Log
BH-02
BH02-185
15
18.5
Gravels & Gravel Mixtures
—
GP GC - Poorly Graded Gravel with Clay
—
—
Mottled
Moist
Hard
Report ready: Borehole Log & Drilling Report
Frequently asked questions
The written record of a borehole: the strata encountered with depths, samples taken, tests run, groundwater observed, and the logger's remarks. It is the primary record of a subsurface investigation — see the sections above, and the field logging standards listed in our sources.
A trained field logger or engineer/geologist, often with the driller calling observations at the rig. Completed logs are reviewed and signed by a qualified professional before being issued.
The Standard Penetration Test drives a standard sampler with a standard hammer and counts the blows. The resulting N-value is a widely used indicator of soil density and strength, and the same test recovers a physical sample. The method is defined in ASTM D1586/D1586M.
No — and the distinction matters. A scanned PDF is preserved but not structured; a digitized record has depths, materials and test results as fields. The Geosetta snapshot above shows how different archives can be.
aQRate is a data platform for environmental and water work. Its Borehole Logs Starter Template applies the principles on this page: capture once in the field, keep records structured and linked, and generate reports from the same data. You can try the live preview above.
No. Structured data makes professional judgment better informed — the log, its interpretation, and the design decisions that follow remain the work of qualified professionals.